

Australia Excess Deaths Covid & Vaccination
Australia Excess Deaths Covid & Vaccination
Which superficial explanation looks like a better explanation?

The first chart shows deaths in Australia from all causes, but excluding COVID.
Australia had fairly normal levels of death other than covid in 2020 and 2021, but deaths went above average at the start of 2022.
We are searching for a possible cause of this 2022 increase in deaths that didn’t have COVID on the death certificate.
“You’re ignoring the elephant in the room, bro”
The blue line is the average of deaths in previous years. The blue band around the line is the range of normal levels of death, some years higher than average and some years lower.
The coloured dots are the actual recorded non-covid deaths. So that’s all the deaths minus those that had COVID on the death certificate.
In 2020 deaths were below average for the middle of the year and around average during 2021, but above average in 2022.

“The elephant, bro, show us the elephant”
The elephant that everyone is supposedly refusing to see is the idea that the vaccines are responsible for masses of deaths. Therefore let’s go elephant spotting.
Australia began to vaccinate at the end of February 2021. The following chart isn’t on the same time scale in that it begins in Feb 2021 and the time axis along the bottom is in days since the start of the campaign rather than months of the year.
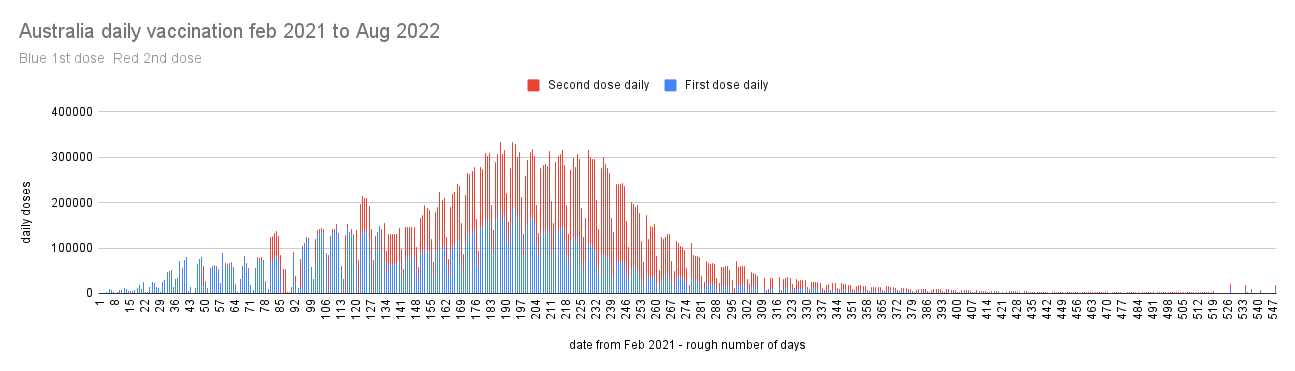
The first vaccine doses are shown as blue columns. The second vaccine doses are red columns. They started in February 2021 and continued for more than a year, but the numbers peaked around 200 days which is roughly September 2021 and then declined in daily numbers.
The first & second vaccine doses were almost all done within 280 days from Feb 2021 or about 9 months which is Nov 2021.
The excess deaths show up about 2 months later. Those who claim that vaccines caused a spike in death during the first 7 to 14 days, would have difficulty explaining why this didn’t happen in Australia.
To argue that the vaccine is the cause of the excess deaths requires some kind of delay mechanism. For the effect to only show up 2 months after a long spread out vaccination period either means the Vax have clocks built in to start on a specific date or the increase in deaths in January 2022 are from the vaccines in Feb 2021 and this 1 year delay will now cause a massive rise over the next 9 months.
I assume that will be the preferred interpretation by those who blame the vaccine.
What other things happened during this time that could be relevant? A quick search for covid case numbers and deaths produced this chart from the WHO

This chart from the World Health Organisation shows that COVID case numbers and deaths rose dramatically in January 2022.
That coincides with the rise of excess deaths.
Analysis by looking at some graphs is crude & subject to considerable uncertainty, but it is very tempting to say that
the excess deaths are highly correlated to the rise in cases and COVID deaths and only very weakly correlated to vaccination.
There is another correlation. The rise in non-covid excess deaths is when Omicron arrived.
Hypothesis: Omicron is killing at a lower rate in the acute phase, but it has a higher kill rate than previous variants in the post recovery phase.
That is just a wild hypothesis, but a bit more likely than the elephant in the room claim.
and here:
https://i0.wp.com/theethicalskeptic.com/wp-content/uploads/2022/08/Vaccine-and-Death-Arrival-Chart-2.jpg?ssl=1
https://theethicalskeptic.com/2022/08/20/houston-we-have-a-problem-part-1-of-3/
boom! now you see the 2 months delay:
https://twitter.com/RetsefL/status/1633089224353120257?s=20