

Decline in life expectancy from Covid
Decline in life expectancy from Covid
Surprising & hard to interpret

Here is a comparison of the life expectancy in England estimated for the period 2017 to 2019 compared to the latest estimate 2018 - 2020. (The latter estimate includes the effect of Covid.)
You won’t be surprised that the life expectancy was lower in a period that includes lots of deaths from a novel Corona virus, but perhaps you will be surprised at the relationship of life expectancy, age & the effects of Covid.
Everyone knows that the risk of death from Covid rises with age, but what about the amount it reduces your life expectancy?
Here is the chart for females in England. It shows how many days their life expectancy was reduced compared to their age.
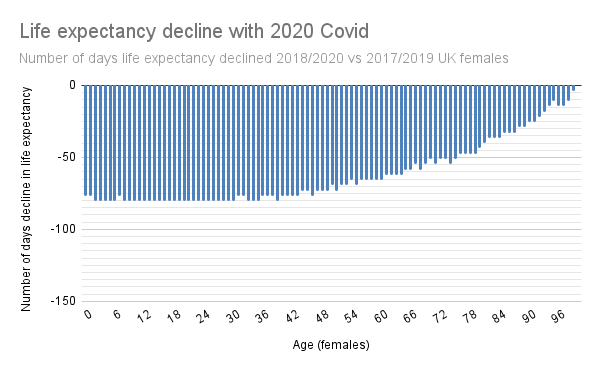
This shows that young females had their life expectancy shortened by about 80 days, but around the age of 40 the loss of life expectancy starts to lessen. At 65 the loss is around 58 days.
Compare to the graph for males.

Clearly the decline in life expectancy for males was much greater than for females.
Young males lost about 130 days (compared to females at 80 days). This is fairly constant until age 50 (compared to females constant until about 40). At 65 this lessens to about 91 days (compared to females of around 58 days)
The oldest males lost about 18 days whereas the oldest females didn’t lose any days.
The losses were constant for the first few decades.
Males lost more days than females lost.
The number of days lost declines from 40 for females & 50 for males.
I have no idea why.
This is a download of an Excel document of many pages.
Method
The above graphs use the 2018-2020 & 2017-2019 sheets.
Columns A (age), F (male expectancy) of each period was listed on the same sheet
and separately the N(female expectancy) of each period were listed on the same sheet.
The expectancy of the 2018-2020 sheet was subtracted from the expectancy of the 2017-2019 sheet for males and separately for females. This produced a column of fractions of years of decline of life expectancy for each sex.
Those fractions of a year of life expectancy were then multiplied by -365 to produce the number of days of decline.
These were then graphed.